The primary tool I will be using to read and debug code is VS Code. I have been using it for years, so all of the examples in this guide will use it. You can download it from the official download page for macOS or Windows.
Or if you are on macOS and already use
Homebrew, you can also install it from the terminal with
brew install --cask visual-studio-code
directly.
We know that AI, or especially AI Agents can generate a lot of code.
You can still plan ahead, break the project into smaller vertical
slices, and avoid one-shot prompts. But even then, you can quickly end
up with a huge amount of AI-generated code, especially if the project
is complex, or sometimes you're just a bit unfamiliar with the
programming language or the framework you are using, or if you are
working with a fresh codebase that you are trying to learn, contribute
to, or build on.
The first shortcut is Command + F on macOS. On Windows, use Ctrl + F.
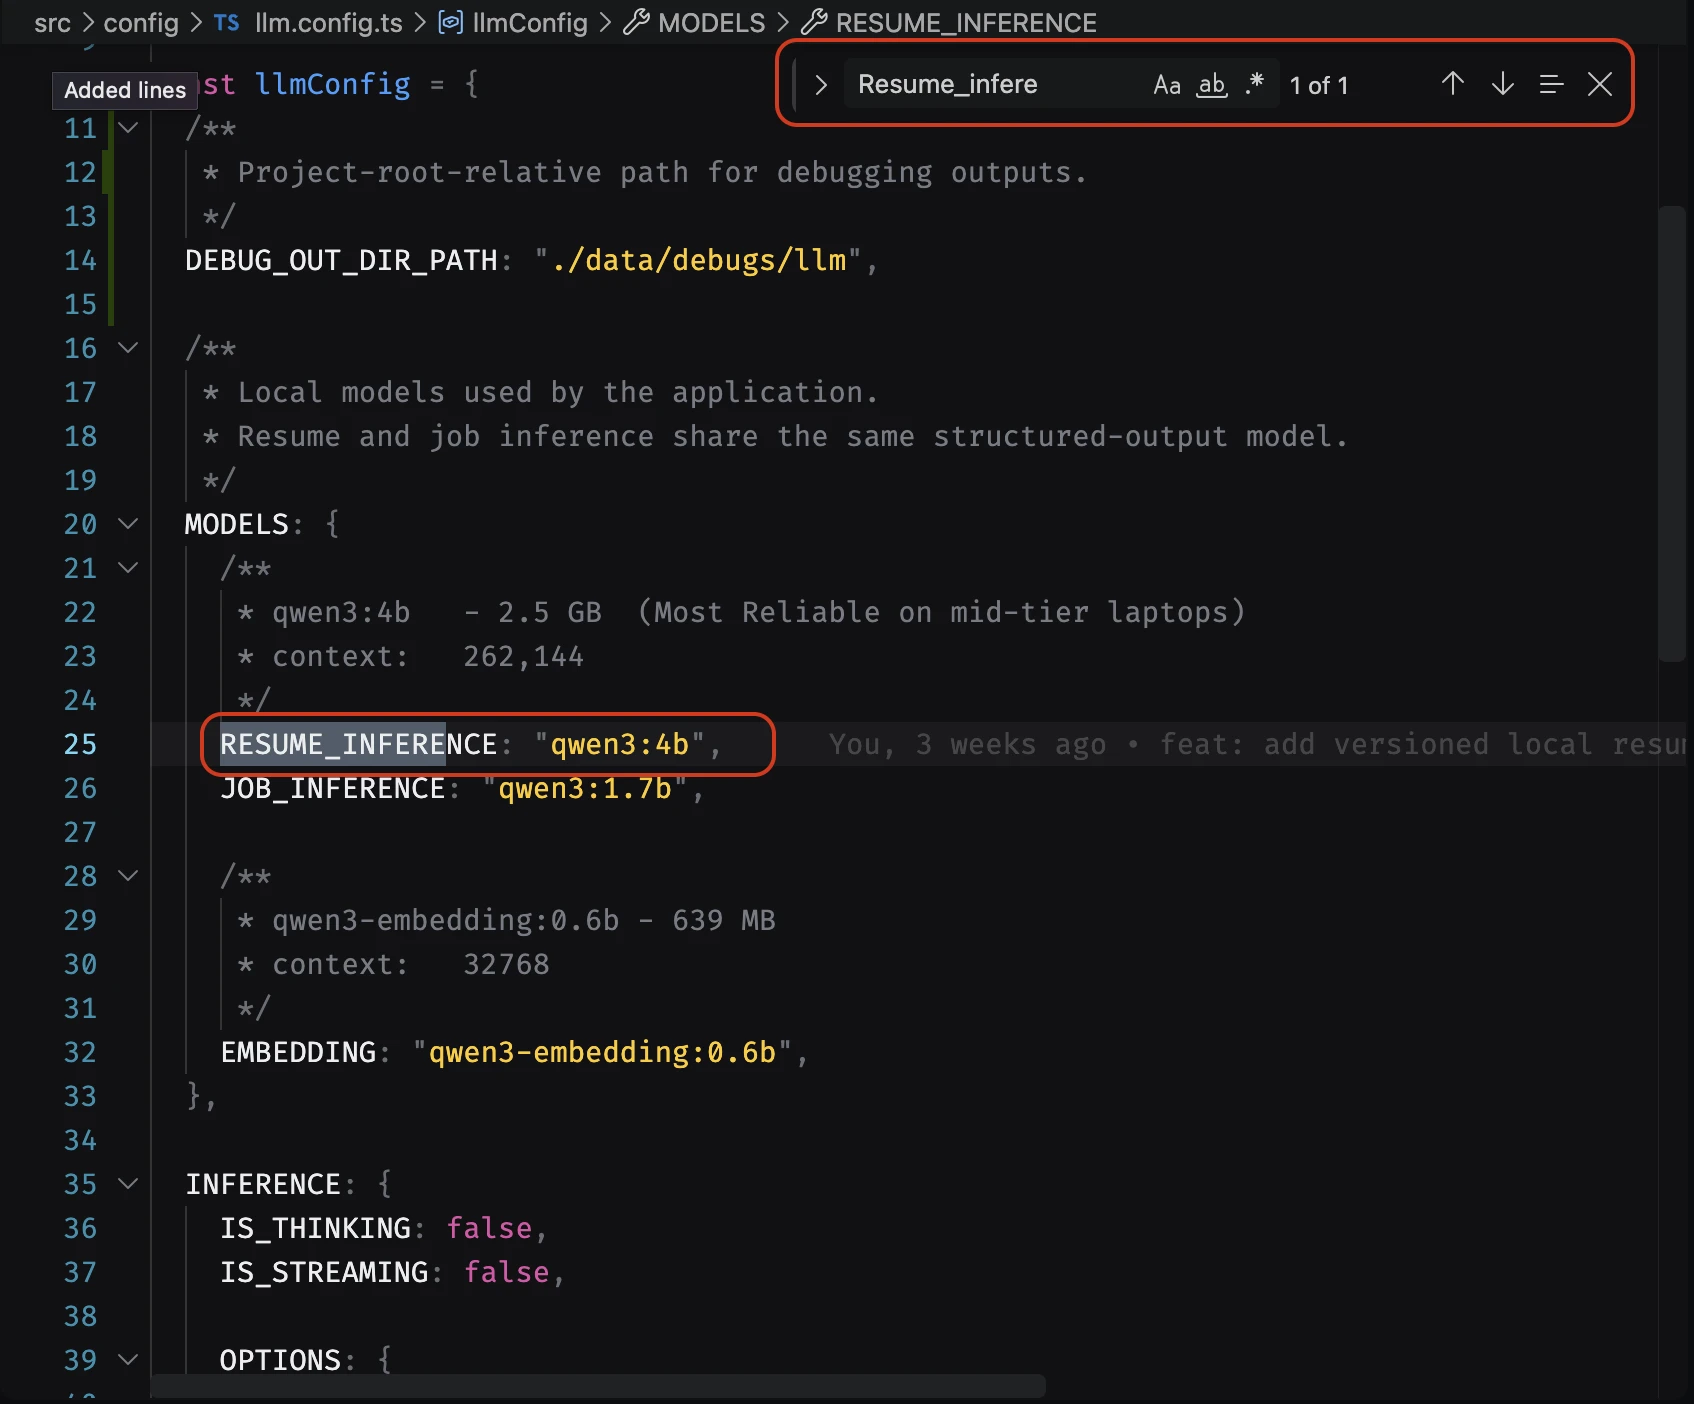
This is called Finder. It opens the Find box in the top-right corner of the current file. You can type any text and move through matching results by pressing Return (Enter). VS Code also gives you options for case-sensitive matching, whole-word matching, and regex (the options beside the search input).
I use it to quickly check a variable, see where a function is called in the code, or find where a class is instantiated within the current file.
The next shortcut is Command + Shift + F on macOS. On Windows, use Ctrl + Shift + F.
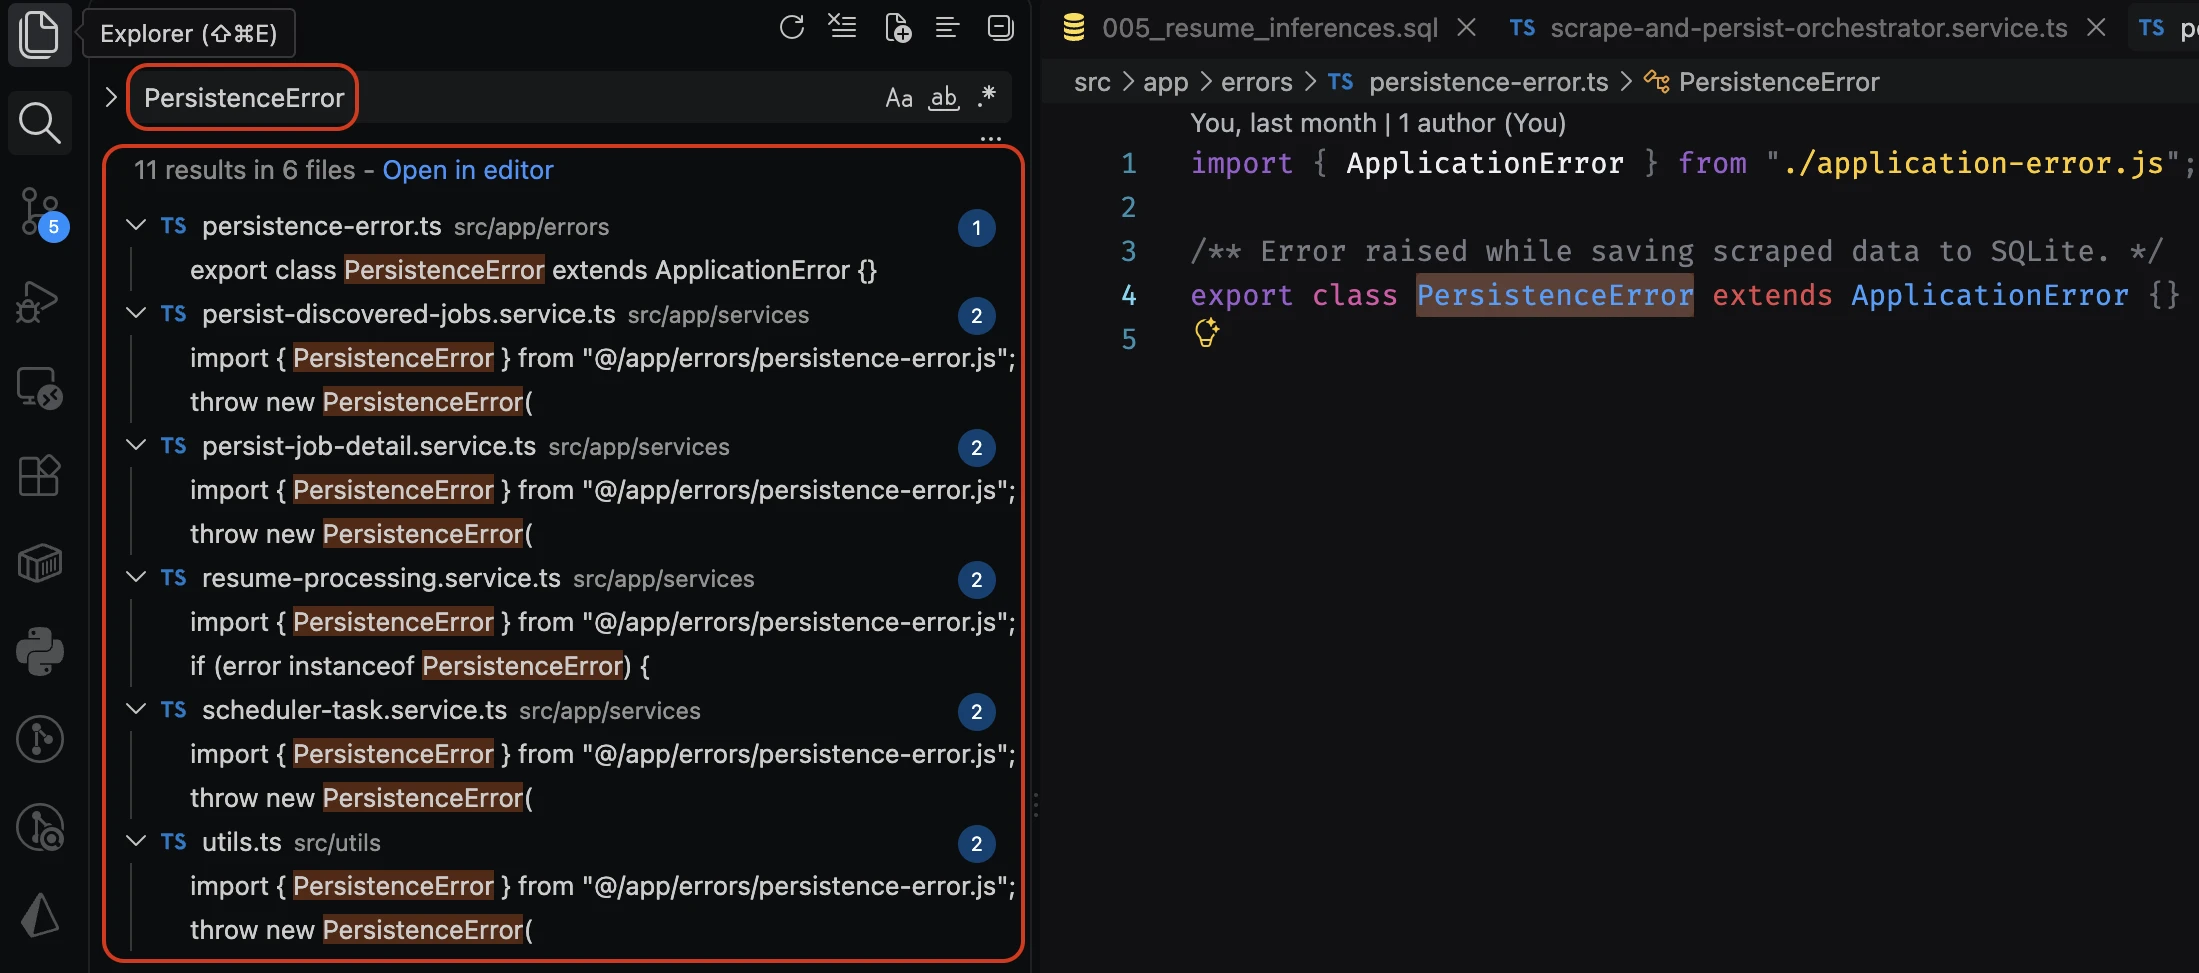
This is one of my favourite and is called Find in Files. It performs a global text search across the project or workspace you currently have open.
It will show a list of matched files along with the parts of the code where the search term appears. I use this when I want to trace a method or variable across multiple files without manually opening each one.
In this example screenshot, I searched for PersistenceError, and VS Code shows me the names of the matched files along with the places where that search term appears inside each file. You can simply click on any result, and VS Code will take you directly to that location in the code.
As the project grows, you will eventually have too many directories and files to simply memorize where everything is. This is where Command + P on macOS becomes very useful. On Windows, use Ctrl + P.
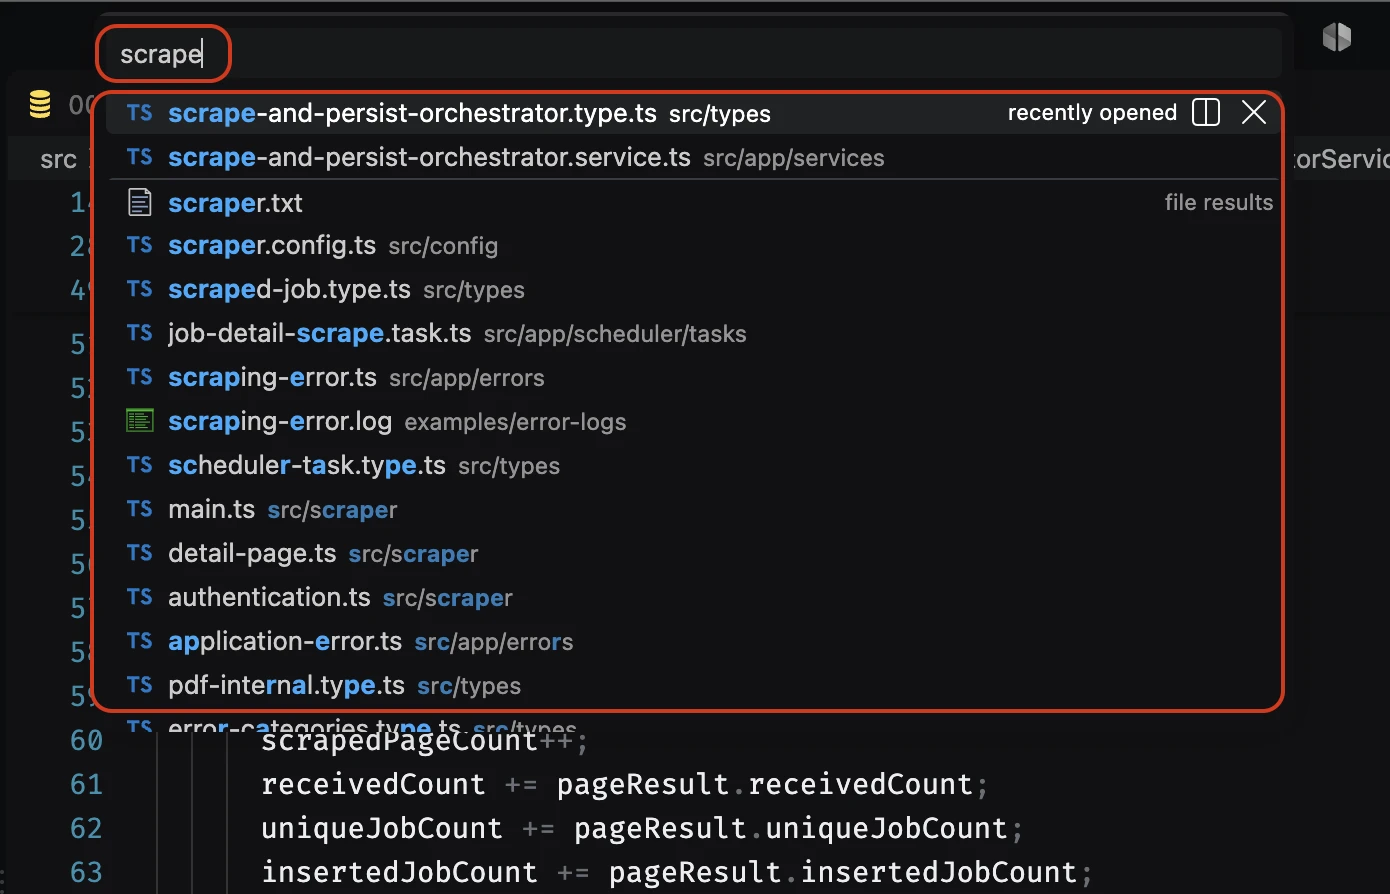
This is called Quick Open. It
performs a fuzzy search for files in the workspace, so you only need to remember part of the filename to quickly jump
to the file you are looking for.
*
Even files with the same name but located in different directories
will appear in the results.
I usually use this when I am implementing a specific feature or reading through the code related to that feature, and I want to quickly jump between the files that are connected to each other.
One thing to keep in mind is that files and directories listed in .gitignore (you can check yours in the project) may be excluded from VS Code's workspace search, depending on your settings. This can affect both Command + Shift + F for Find in Files and Command + P for Quick Open, because those ignored files may not be included in the normal workspace search results.
Quick Open has one useful exception though. If you recently opened a file manually, even a git-ignored file or a file outside the current project, it can still appear in your recently opened files and be accessible through Quick Open, even though it is not part of the normal workspace search.
Final shortcut I would like to share with you is
Command + Click
on macOS.
On Windows, use Ctrl + Click.
This is basically Go to Definition. You can use it on symbols such as variables, functions, methods, classes, or imported objects to jump directly to where they are originally defined.
I use this all the time when reading unfamiliar code. Instead of searching manually for where something comes from, I just click the symbol and follow it to its definition.
This also works beyond your own code, letting VS Code jump into installed packages, type definitions, or library source code so you can inspect what a dependency is actually doing underneath.
Quick Git Wins
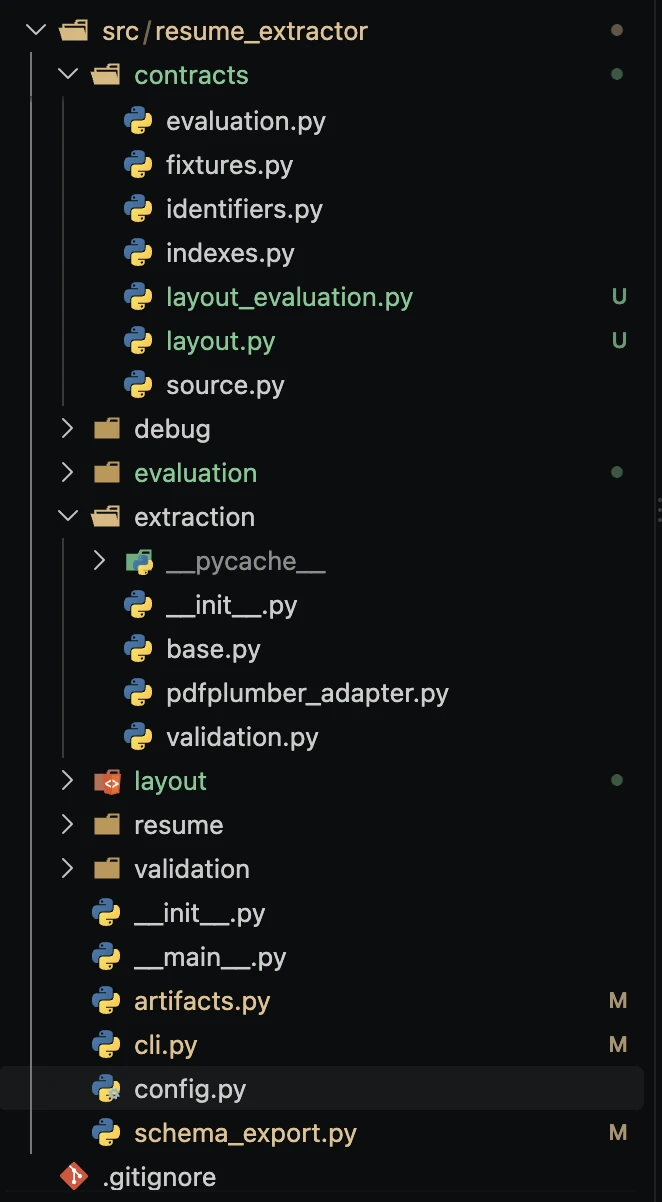
In VS Code's Explorer (the directory tree sidebar), you can also quickly see Git changes through the file and folder colors. The yellowish-orange color means an existing file has been modified, while green means a new file has been created and is currently untracked.
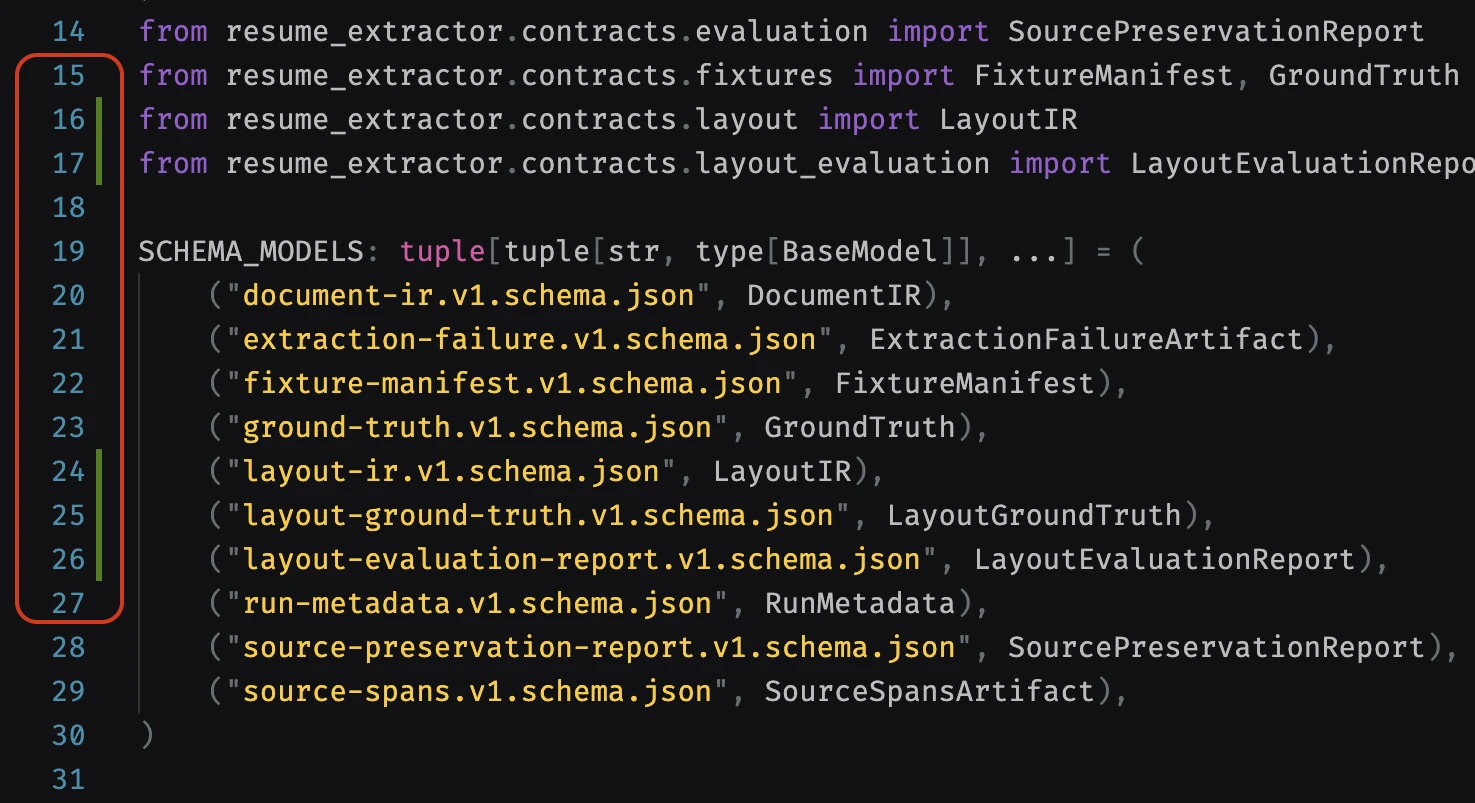
VS Code also shows Git changes directly beside the line numbers in the editor:
- Green bar - new lines were added.
- Blue bar - existing lines were modified.
- Red triangle or marker - lines were deleted.
Every time an AI agent generates new directories, files, or code, you can quickly see which files were newly created and which existing files were modified. From there, you can browse those files and inspect the specific lines of code using the commands I mentioned above.
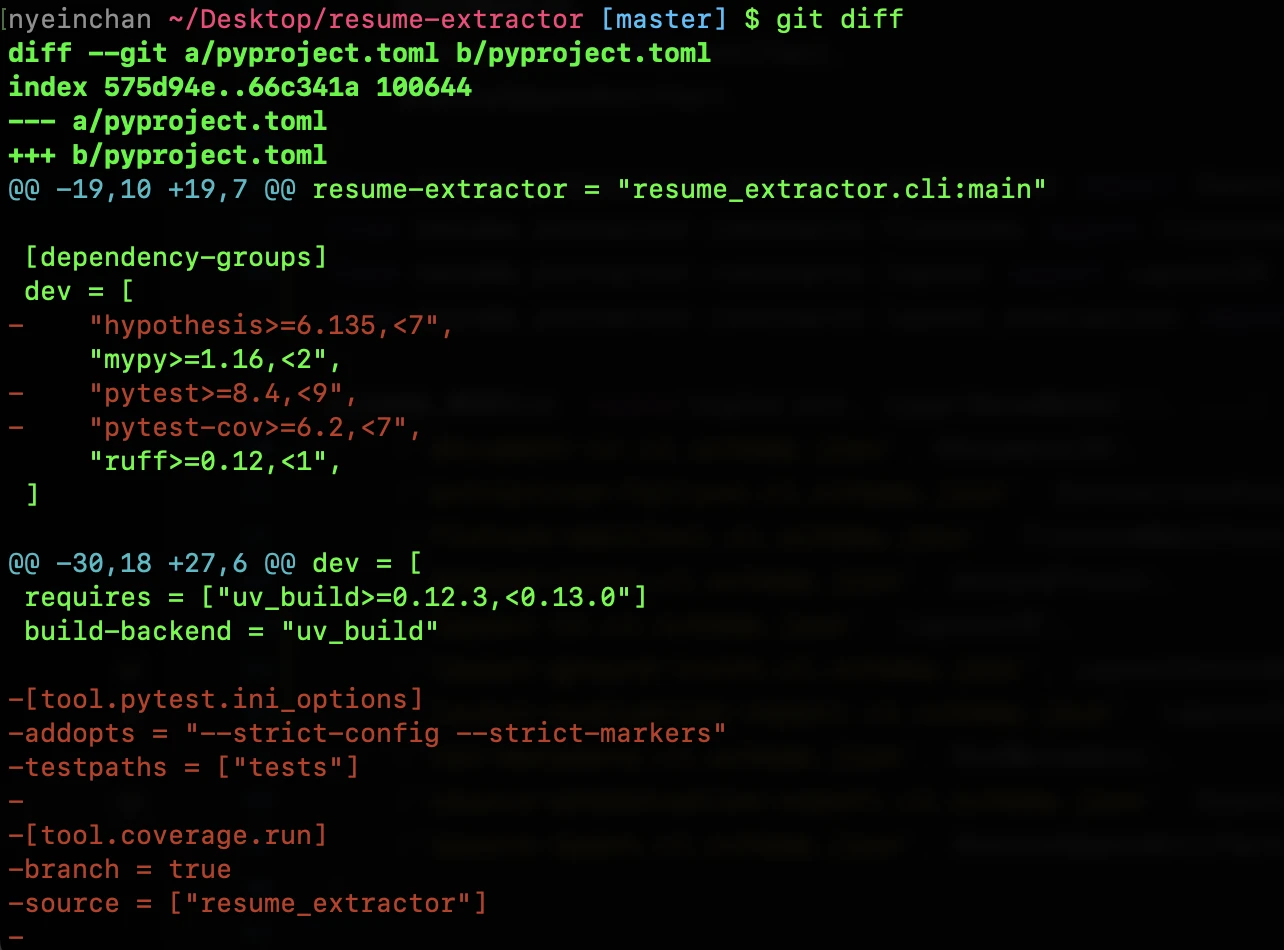
You can also review changes directly from the terminal by running
git diff
from your project root.
If the output is long, just press
Space
to move through it quickly.
You don't really need to read every single change. My suggestion is to focus on the files that actually matter for the feature you are working on. In fact, you can check a specific file with git diff <file-path> and then reason through the changes in that file more carefully.
That's it. Now you know how to navigate through files, trace where things are used, and follow AI-generated code a little more easily.
I hope this article was helpful for you.
I will write Part 2 sometime within this week. It will be slightly more advanced and focus more on using the debugger to trace how your application actually behaves at runtime.